15 Fundamental KPI Retail Metrics [And How to Measure Them]
Anyone with a small business knows that the numbers don’t lie. But maybe you don’t know how to use numbers to put MORE money in your pocket? If you want to increase retail sales performance, your first step must be able to properly track and measure KPI retail metrics.
Retail is a hyper-competitive industry.
And, I promise, your competition is already tracking and measuring retail metrics and key performance indicators (KPIs).
But, where should you start?
To point you in the right direction, here are the retail metrics that are the bedrock of retail sales performance – and how to calculate these KPIs.
While every retail store is different, luckily there are cornerstone KPIs that should be the foundation of any retail industry performance metrics.
These days, the most successful retail stores have become completely obsessed with metrics.
They all swim in data.
Your retail business should too!
Every retail marketing and promotional decision should be driven by data.
Without this data, you don’t know what’s working, what’s failing, or even what success looks like.
While there are countless KPI retail metrics that you could possibly track, we’ve outlined here the ones most importantly to the growth of your business.
1. Conversion Rate
“Conversion Rate” – the two most important words for KPI retail metrics.
Simply put, retail conversion rate measures the proportion of visitors to a store that make a purchase.
The ultimate goal of any retail enterprise is to convert sales, making your conversion rate paramount to success.
For example, if 500 people enter your store in a day, but only 50 buy something, the retail conversion rate is 10%.
Conversion Rate = number of visitors / number of individual purchases x 100
In order to accurately establish retail conversion, you must not only measure the number of visitors, but also understand how to interpret the data.
Conversion rate is important for any retail business to measure.
The retail conversion rate can assess the effectiveness of marketing efforts or operational actions.
This can mean things like adjusting store layout, hiring extra employees, adjusting stock levels or pushing promotions.
After looking at your current conversion rate, you might think adjusting store layout could improve sales.
Use your data!
Just calculate your conversion rate before any changes, and then measure this benchmark against the performance of the new store layout.
If you’re selling clothing and apparel in a brick-and-mortar retail store, your retail KPI conversion rate should be 20 – 40%.
This means, on average, 70% of your customers leave without buying anything!
While it’s never 100% (even ice cream restaurant on a hot day does not convert 100%), it differs from industry to industry.
Yet, don’t feel too relieved if you’re in that range.
To succeed, you need to be better than others.
Retail metrics, like conversion rate, are KPIs you must start tracking + acting upon if you want to promote retail growth.
2. Sales per Square Foot
Sales per square foot is another important KPI retail.
This industry metric is most commonly used for retail inventory management.
All retail owners should ensure their point of sale system offers features which allow you to accurately track stock levels.
eHopper POS inventory management features include:
- Purchase order receiving, to prevent stock shortages
- Inventory adjustments, so you can adjust stock of damaged, lost, or stolen items in specified stores
- Product management, to create inventory items, non-inventory items, serialized products, products with ingredients, or matrix products
Once you have are accurately tracking your inventory through your point of sale, you can determine your retail sales per square feet.
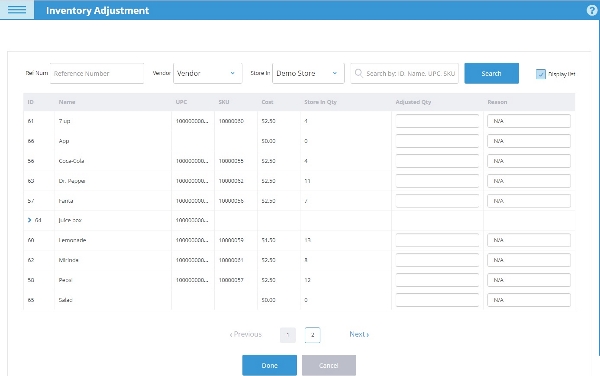
With inventory adjustments feature you can adjust stock of damaged, lost, or stolen items in specified stores
This data can also roughly calculate return on investment (ROI) and is used to calculate rent at a retail locations.
When measuring sales per square foot, keep in mind that selling space does not include the stock room or any area where products are not displayed – just the “usable” selling floor.
To calculate sales per square foot:
Sales per Square Foot = Total Net Sales ÷ Square Feet of Selling Space
3. Gross Profit vs Net profit
Know the difference between Gross profit margin vs net profit margin?
These retail metrics have important differences.
Gross profit margin and net profit margin are two different retail KPIs that business owners can use to assess a company’s stability and financial health.
Gross Profit Margin
Profit margin is a measurement of profit that indicates the amount a company earns per dollar of sales.
Thus, if a company makes more money per sale, it has a higher profit margin.
However, Gross profit margin is the measure of profit which expresses the percentage of revenue which exceeds the cost of goods.
It is used to illustrate how successful a company’s executive management team is in generating revenue verses the costs that are involved in producing their products and services.
Basically, the higher the number, the more efficient your retail business is in turning a profit for every dollar of labor cost involved.
Gross Profit Margin = (total revenue – cost of goods sold (COGS) / total revenue) * 100
The gross margin result is typically represented as a percentage.
Retailers should view COGS as the amount it costs a company to produce the goods or services that it sells.
Net Profit Margin
The net profit margin is the ratio of net profits to revenues for a company or business segment.
Expressed as a percentage, net profit margins show how much of each dollar collected by a company as revenue translates into profit.
Net Profit Margin is one of the most important retail metrics.
This is because any increase in revenue won’t necessarily translate to profit.
You must make this distinction in any retail KPI analysis.
Net profit is the gross profit (revenue minus cost of goods) minus operating expenses and all other expenses, such as taxes and interest paid on debt.
4. Gross Margin Return on Investment (GMROI)
GMROI is an important retail metric used to help buyers determine if a sufficient gross margin is earned by the products purchased.
Then, you compare you can compare the investment in inventory required to generate those gross margin dollars.
For example, if your store has a sales volume of $2 million a year on an average inventory of $600,000, that would be very good.
But $2 million on an average inventory of $200,000 (though uncommon) would be even better.
GMROI = Gross Margin $ ÷ Average Inventory Cost
5. Sales per Category & Sales per Employee
Using the best retail point of sale software means a small business owner can always determine valuable KPIs like:
- Shopper to Staff Ratio
- Average number of shoppers per transaction
- Average sales per transaction
- Sales per employee
- Sales per shift or time of day
- Sales by product category
eHopper POS offers a robust pos reporting deck, allowing retailers to export sales data to measure exactly when your store has it’s highest sales, and which employees drive the most revenue.
6. Average Transaction Value
Retail average transaction value is calculated by dividing the total value of all transactions by the number of transactions or sales.
Average transaction value is an important kpi retail metric to understand.
For example:
Sales of $400,000 for the year, generated from 10 sales or transactions.
The equation would be 400,000 / 10 = $40,000. The average transaction value is $40,000.
Mistakes to avoid:
- Not considering the costs involved in the transactions or process.
- Utilizing a certain cut-off period (IE sales transactions may fall over into the following period and therefore certain costs may be missed).
- Up-selling products or services to increase the average transaction value.
The average number of transactions is calculated by using the number of transactions over a specified period of time and dividing that by the time period of the desired outcome.
Average Number of Transactions = number of transactions during time period / time period
Mistakes to avoid:
- Coupling transactions together as a single sale.
- Expanding a single transaction to multiple transactions.
- Using data from a specific time period, taking into account seasonal expectations if need be.
7. Units per Transaction
If you own or manage any store, units per transaction (also called items per sale) can be a very one of the useful retail metrics for evaluating sales trends.
You should measure this KPI retail to track things like product sales over time, or employee sales performance.
This retail metric should be used to ascertain if a revenue increase means your are selling more products, or if shoppers are buying items that are more costly.
How do you calculate units per transaction?
Calculating units per transaction is simple.
Units per Transaction = items sold / number of transactions
Let’s say employee A made 40 sales with a total of 205 items.
Employee B sold 105 items in 35 transactions.
Employee A has sold 5.1 units per transaction and B 3.0 units per transaction.
With eHopper POS, these sales reports can easily be exported for further analysis.
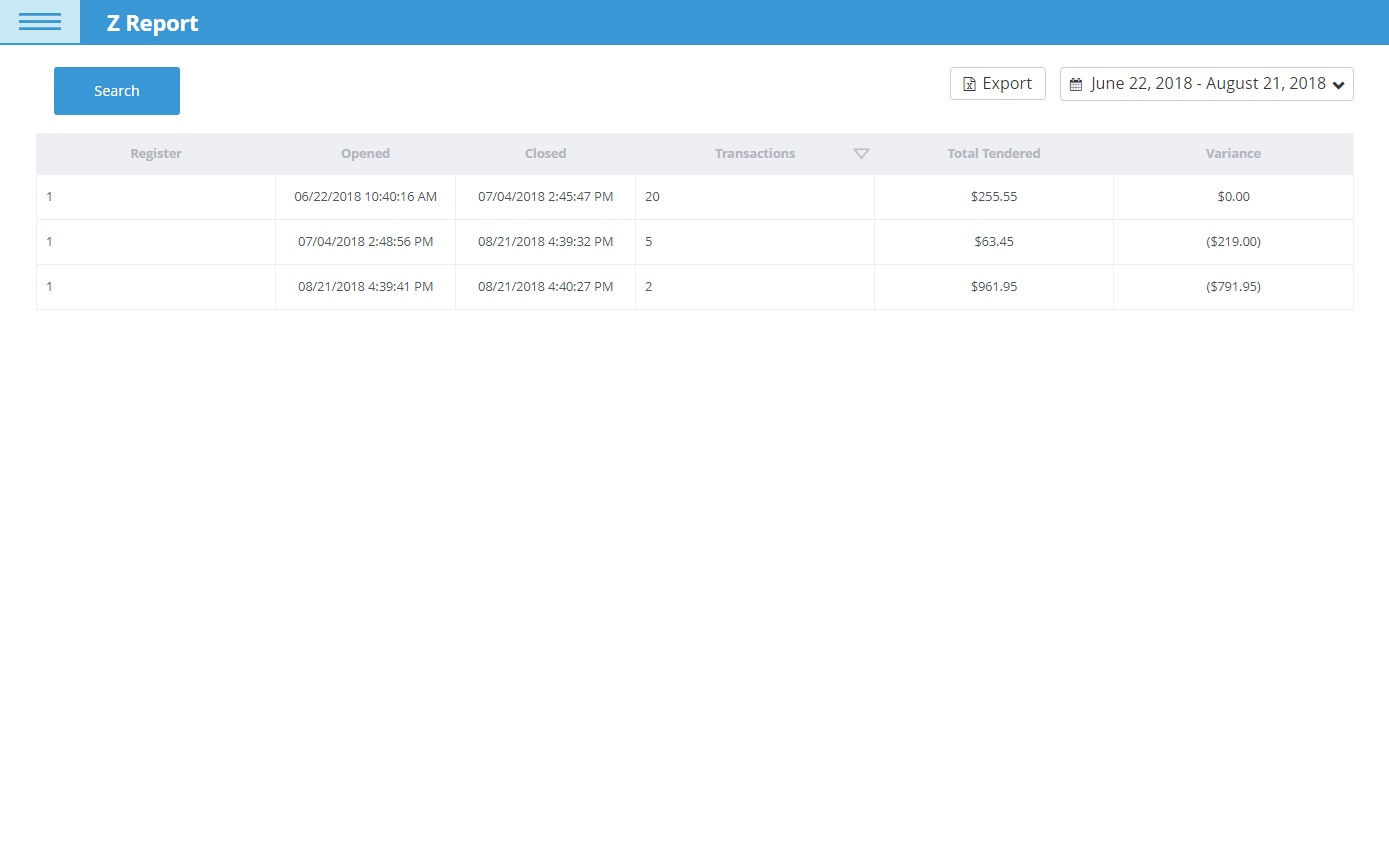
POS sales report
8. Online Sales vs Brick & Mortar Sales
An advanced POS system, such as eHopper, should be able to measure this valuable retail metric.
While every retailer should consider an Omnichannel strategy to grow their business, it’s also important to measure the affect of each sales channel on your revenue.
With eHopper, you can do this by simply exporting your sales report.
With this report, you are able to easily filter online sales vs brick and mortar sales.
Once you begin using your point of sale to track online vs in-store, you are in a position to decide how to drive KPIs in retail.
9. Year Over Year Growth
Year-over-year growth is a comparison of a retail metric for one period to the same period the previous year.
The year-over-year growth rate calculates the percentage change during the past twelve months.
Year-over-year is an important retail metric for two reasons.
First, it removes the effects of seasons.
For example, you might see that retail revenue was up 20% in November.
But, before you start raise a toast to your success, you need to check this number against the revenue from last November.
It could just be that the holiday season boosts sales every November, in a reliable way.
Maybe you should expect your sales to increase this time of year.
With this model, if November sales usually increase around 20%, then your revenue is down year-over-year. Your business is doing worse, not better.
Second, using year over year as a focused retail metric highlights long-term trends.
Maybe your retail shop grows over a steady pace of 3% each month.
However, by tracking year over year change, if your retail shop grew 4% per month the previous year, then year over year is the retail metric that will alert you to declining sales.
Important when considering year over year change – always check if the calendar year or fiscal year is used!
Calculating year over year growth is simple. A business owners only needs two numbers.
Year Over Year Growth = Current year sales total – Previous Year’s Sales Total
That gives you the total difference for the year.
If it’s positive, it indicates a year-over-year gain, not a loss.
10. Break Even Point
For retail metrics, the break event point is the point when your retail sales equal expenses.
Because this is the signal that you are turning profitable, the break even point is a crucial retail metric for businesses of any size.
This is the point in your retail business where sales equal expenses. There is no profit and no loss.
For example, for a liquor store, your rent is likely to be the same regardless of the number of units sold.
Break-Even ($) = Fixed Costs / Gross Margin Percentage
11. Shrinkage
Shrinkage means the loss of inventory.
Often, this can be chalked up to things like employee theft, clerical errors, shoplifting, or shipping damage.
To measure the amount of inventory shrinkage, conduct a physical count of the inventory and calculate its cost, and then subtract this cost from the cost listed in the accounting records.
Shrinkage = physical count of inventory / the amount in the accounting records
This lets you see the inventory shrinkage percentage.
12. Foot traffic
Foot traffic is a fundamental part of any successful brick-and-mortar store. Every small business owner we talk too is all-too familiar with this concept.
We also understand that getting more foot traffic can be a constant worry.
Everyone understands that the more people in your store, the more chances you have to make a sale.
So how can retail stores increase their foot traffic? The first step is to accurate measure it!
We really cannot overstate how important this KPI retail metric is for any business owner.
Related: 7 Tips to Increase Foot Traffic to Your Store
But one major challenge is that some retailers find foot traffic difficult to reliably track.
While there are several unique software tools that can help businesses determine this, for most brick and mortar small business owners, the old school methods work best.
Manually count with a clicker! Yes, it can be that simple. You or an employee needs to watch the sales floor all day, and click a tally each time a customer comes in.
Another option is security cameras! If you have a security camera outside your business, you can calculate foot traffic by watching the tape at a later time, and counting everyone that comes in.
13. Customer retention
Customer retention is an important KPI retail metric that measures how often customers return to your business to make a purchase.
It’s a unique metric because it accounts for both your ability to acquire new customers as well as your ability to increase customer loyalty.
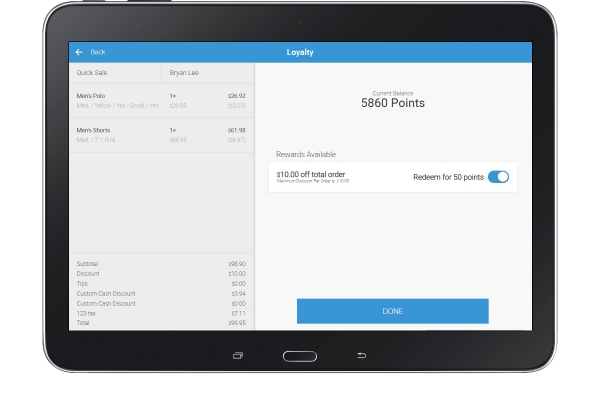
Implementing a loyalty program can increase your retention rate.
Basically, your retail customer retention rate is about transforming new customers into repeat customers.
Why is customer retention an important retail metric?
On average, the higher your customer retention rate, the higher your profits.
Returning customers spend up to 67 percent more than new customers.
Acquiring new customers is on average, 6 to 7 times more expensive than retaining your current customers.
Most businesses see an average of 25 to 40 percent of total revenue coming from their returning customers.
It’s estimated that a mere 5 percent increase in retention can result in a revenue increase of between 25 and 95 percent, so customer retention is an invaluable metric that happens to be particularly useful for measuring customer loyalty.
Customer Retention Rate = ((Customers at end of the period) – (customers gained during the period)) / (number of customers you started with) *100)
Retail metrics are a prevailing force in just about everything a small business owners needs to concern themselves with.
Retention rate is the percent of customers you kept, Churn Rate is the percent of customers you lost.
14. Shopper Dwell Time
More and more retail business takes place online.
So when a customer chooses to go to a brick-and-mortar store in person, there must be:
- A reason for them to go
- Compelling reasons to stay
- A reason to purchase from you
As a business owner, you may think of several approaches to bringing customers in, like sales, a wide selection of items, and help assembling difficult products like furniture.
However, many people do not to go brick-and-mortar stores for these conveniences anymore.
These days, reasons a customer might prefer a brick & mortar to online include:
- Trying out, or putting on a product before they decide to buy it.
- Ask the employees questions.
Retail stores have to adopt an Omnichannel approach to touch the customer at all points of their shopping and buying habits.
With this in mind, one of the fundamental marketing KPIs for retail, is analyzing how modern customers shop inside your store.
This means you can build your retail store around this data.One of the best ways to understand how customers react to your retail store is the KPI retail dwell time.
This is a retail metric that measures how much time customers stay in a specific areas of your store.
Among other retail store metrics, it’s grouped with customer purchasing data like hold/wait time, service time, and transaction time.
Dwell time is an indicator of customer engagement
In theory, your customer is shopping for specific products.
If these products are properly staged, the shopper should be enticed to purchase.
This retail KPI is often represented with heat maps, highlights the areas of the store with the most traffic and how long your average customer lingers in that area of your store.
Dwell time is an excellent retail metric, but it is smart retailers will dive a little deeper into customer psychology.
This means dwell time is how to drive KPIs in retail.
15. Inventory turnover vs sell-through rate
Inventory turnover
Basically, inventory turnover is how many times during a certain calendar period a retailer sells its inventory and replaces it (turnovers) inventory.
Inventory turnover is calculated as follows:
Inventory Turnover = Net Sales / Average Retail Stock
Sell Through Rate
Sell through rate is the KPI retail metric that compares the inventory received from a supplier verses the inventory sold.
This is usually calculated as a percentage.
Sell-Through Rate = Units Sold / Units Received
For example, let’s say you own a hardware store.
You ordered 100 boxes of LED light bulbs to sell in your store.
But at the end of the year, you only sold 10 boxes of lights bulbs. This means that the other 99 boxes are just gathering dust on your shelves!
Your sell-through rate would be 10%.
What every retail store owners needs to remember – when an item sits on your shelf without selling it is costing you money! The space these products take up could be given to products with a higher sell-through rate.
Any business owner needs to keep a close eye on their inventory turnover & sell-through rate.
Conclusion
These 15 key retail metrics should build the foundation of any retail kpi analysis.
However, small business owners are often wearing many hats, leaving them lacking enough free time to properly track and organize this data.
eHopper POS offers a perfect solution for retail with robust reporting features that let you measure these 15 fundamental KPI retail metrics.